
NextPM VS the competition: dynamic spider chart
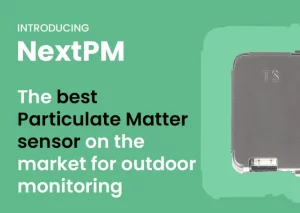
After our recent post about NextPM being the best Particulate Matter sensor on the market we had quite a few emails asking for technical / scientific information that would back up that claim.
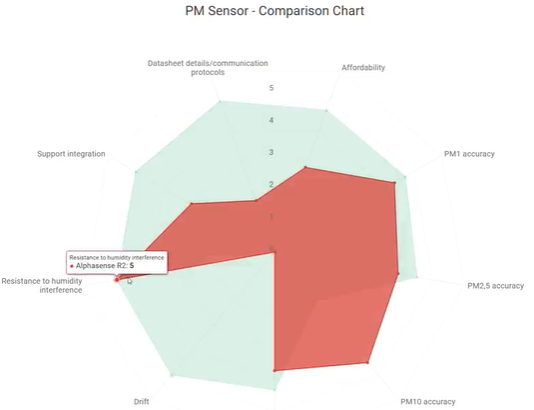
There are of course many aspects to take into account to evaluate which is the best PM sensor: accuracy, price, drift, reproducibility, size… and the choice will directly depend on your specific application.
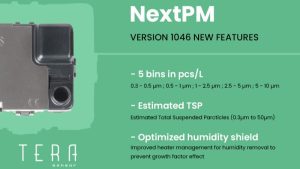
Beyond NextPM key features (such as humidity shield to prevent growth factor effect), we focused on creating a balanced sensor that not only provides accurate data on all PM sizes but also reliable in time and afordable.
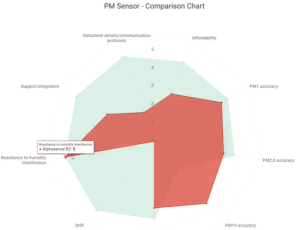
This is the problem with Alphasense R2 that is more accurate than NextPM on PM10 but less on PM2.5 and 1 and rapidly drifts. It is therefore not only more costly to buy but also to operate.
To create this comparison chart we used data open to the public published on AQ SPEC by AQMD. It is an amazing source of high quality data based on lab. and field testing of the major sensor brands on the market.
These data were normalized to be displayed on a common graph.
For more details:
– AQSPEC home page https://lnkd.in/dbCeRVJH
– NextPM in depth tech presentation https://lnkd.in/du7dTHTD
– Dynamic spider chart featured in the video https://lnkd.in/g-ekK5XJ
For specific questions, feel free to reach out!
hashtag#airquality hashtag#sensortechnology hashtag#terasensor hashtag#nextpm

